Web
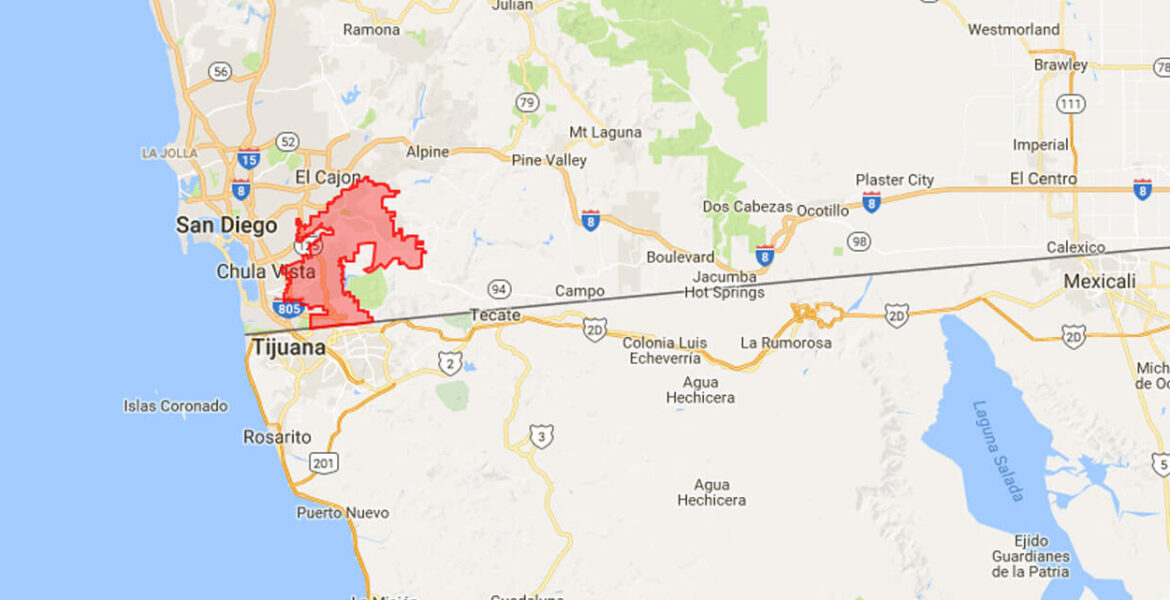
Service Area Map
Browser-based territory visualization so teams answer coverage questions without digging through spreadsheets.
Context
Organizations with geographic service boundaries often rely on spreadsheets or static PDFs. A web-based map turns that into something teams can explore and align on in meetings.
Overview
We delivered an interactive map experience that renders service territories clearly in the browser—no install, usable on tablets in the field.
Challenge
Raw boundary data is hard to interpret. The client needed stakeholders to answer “are we in coverage?” without training.
Delivery approach
Nightcoders built map interactions with legible boundaries, zoom behavior that stays stable on mobile, and labeling that scales with the view. Performance and clarity beat decorative map styling.
Technical & operational notes
The map layer emphasized legible boundaries and stable pan/zoom on tablets over decorative styling. Rendering choices favored clarity at typical sales-meeting screen sizes rather than maximum visual density.
Scope & deliverables
- Interactive territory display
- Responsive map controls
- Web-based access
- Performance-conscious rendering
Operational value
Better internal alignment on coverage reduces sales and operations friction. We stay descriptive about product scope rather than claiming measured cost savings.
Related solution guides
Deeper context on industries and regions this work relates to—not generic SEO pages.
Related services
Similar stack or stakeholder mix? Send a short brief—integrations, compliance hints, and release ownership matter as much as feature lists, and we will be candid about fit.